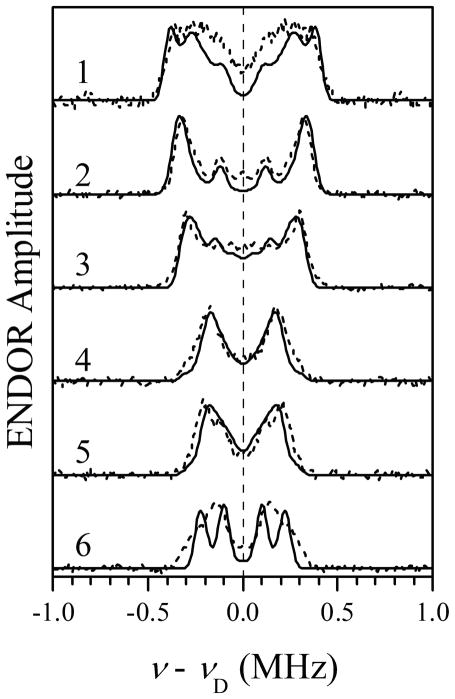
Figure 8.
Simulations of 2H Mims ENDOR spectra for D2 and D5 of Im1 and D5 of Im2 (solid traces), assuming ghf to correspond to the g-frame axis Zg (//Zm). The simulation parameters for D2 and D5 of Im1 are the same as those in Figure 7. Simulation parameters for D5 of Im2: aiso = 0 MHz; T⊥ = −0.18 MHz; e2Qq/h = 0.18 MHz; η= 0; θh = 44°; ϕh = −5°; θq = 60°; ϕq = 20°. Other simulation parameters are the same as in Figure 7. The simulated spectra were convoluted with a Gaussian line with the width of 0.05 MHz between the maximum slope points. Dashed traces, symmetrized experimental spectra reproduced from Figure 3.

