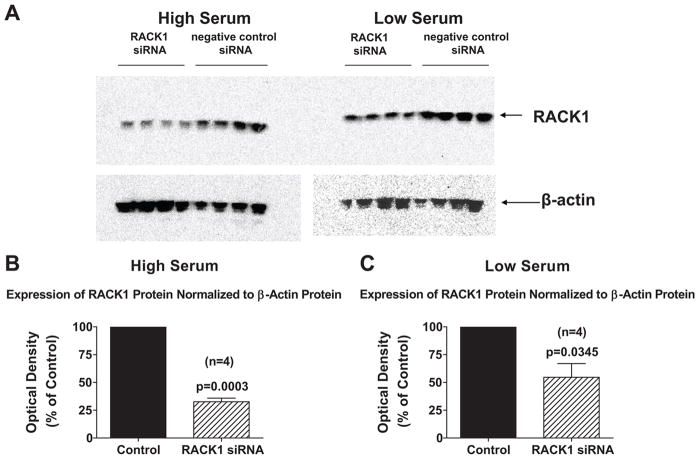
Figure 1.
Panel A shows Western blots demonstrating the effects of RACK1 siRNA versus negative control siRNA on RACK1 protein expression in preglomerular vascular smooth muscle cells when cells were grown in the presence of either high (2.5%) or low (0.1%) serum in the medium. For both negative control siRNA-treated cells (Control) and RACK1 siRNA-treated cells (RACK1 siRNA), the RACK1 protein expression was normalized to β-actin protein expression by calculating the optical density ratio (optical density of RACK1 band divided by optical density of β-actin band). The optical density ratio for RACK1 siRNA cells was expressed as a % of the average optical density for the Control cells. Panels B and C show results for cells grown in presence of high or low serum in the medium. Values represent means ± SEM, and p-values are from unpaired Student’s t-test.

