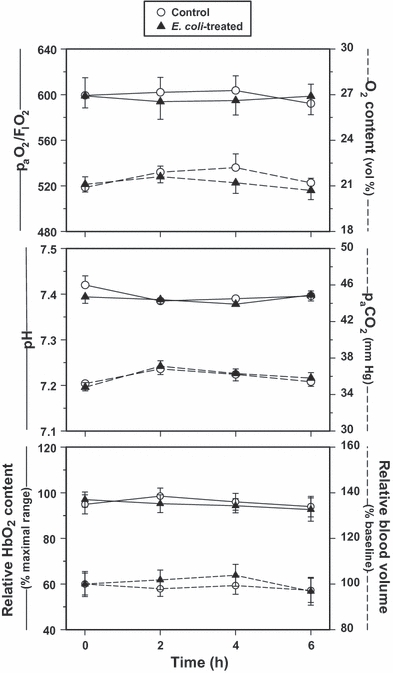
Figure 1.

(Top) paO2-to-FIO2 ratio and arterial O2 content, (Middle) pH and paCO2 and (Bottom) relative ileal HbO2 content and blood volume of the Escherichia coli-treated and control groups as measured over time (values are mean ± SEM). All measurements were comparatively stable over the study period, indicating adequate resuscitation of the E. coli-treated animals and ample O2 availability in the ileal tissues throughout the 6-h experiment.
