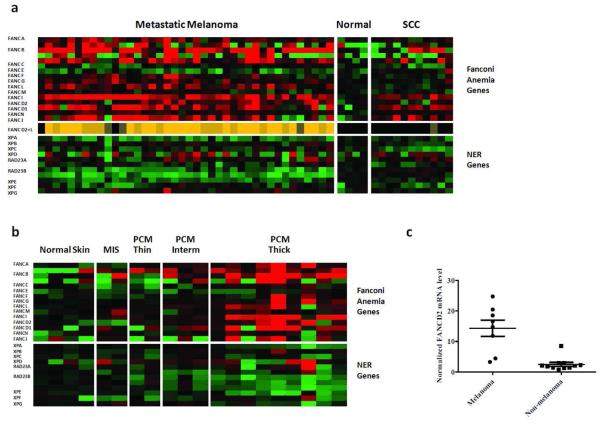
Figure 1. Fanconi anemia, but not NER, genes are transcriptionally upregulated in melanoma compared to normal skin and NMSC.
(a) Microarray analysis of Fanconi anemia and NER gene expression in MM and SCC. Green and red represent decreased and increased expression relative to control, respectively. Color intensity is proportional to expression level up to a 4-fold difference from control. Middle row shows combined expression of FANCD2 + FANCL relative to normal skin; dark brown, medium tan, and orange denote 25-50% greater, 50-100% greater, and more than 100% greater than normal, respectively. (b) DNA microarray analysis of FA and NER genes in PCM. (c) qRT-PCR analysis of FANCD2 expression in PCM vs NMSC. FANCD2 expression levels were normalized to β-actin mRNA levels. Vertical bars represent standard error.

