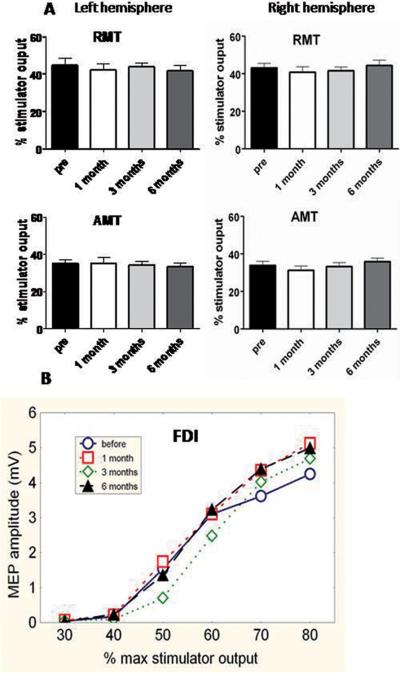
Figure 1. DBS effect on cortico-spinal excitability.
Top: Active and resting motor thresholds (AMT and RMT) of both hemispheres for the contralateral FDI muscle at each time of assessment. There were no significant changes in resting or active motor thresholds pre and post-implantation. Error bars indicate SE. One way rmANOVAs with main factor TIME gave: RMT left: F(3,21)=0.57, p>0.5; right: F(3,21)=1.0, p>0.1. AMT left: F(3,21)=0.21, p>0.5; right: F(3,21)=1.0, p>0.1.
Bottom: Average I/O curves for the dominant FDI muscle at each of the 4 times of assessment (pre-surgery, one, three and six months after surgery). The x-axis shows TMS stimulator intensity as percent of maximum stimulator output. The y-axis shows peak-to-peak amplitude of the MEP evoked in the FDI muscle. There was no change in I/O curves over the times of assessment. A two way rmANOVA with TIME and INTENSITY as main factors did not reveal a significant change for TIME, F(3,21)=0.44, p>0.5 nor significant TIME × INTENSITY interaction, F(15,105)=0.61, p>0.5. As expected, there was a significant main effect of STIMULUS INTENSITY, F (5,35)=21.72, p<0.001. Although mean data from all patients are shown, the statistics were repeated measures in each individual, so that minor differences in thresholds between individuals which could smooth the mean I/O curves, are taken into account.

