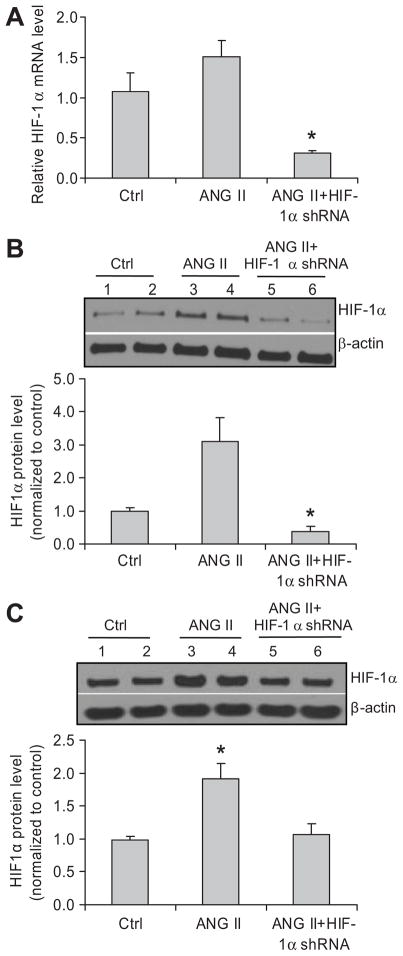
Figure 1. Effect of HIF-1α shRNA on ANG II-induced activation of HIF-1α in the kidneys.
Panel A: HIF-1α mRNA levels in the renal cortex by Real-time RT-PCR analysis; Panel B (cortex) and C (medulla): representative ECL gel documents of Western blot analyses depicting the protein levels of HIF-1α and summarized intensities of HIF-1α blots. *P < 0.05 vs. all other groups (n=6).

