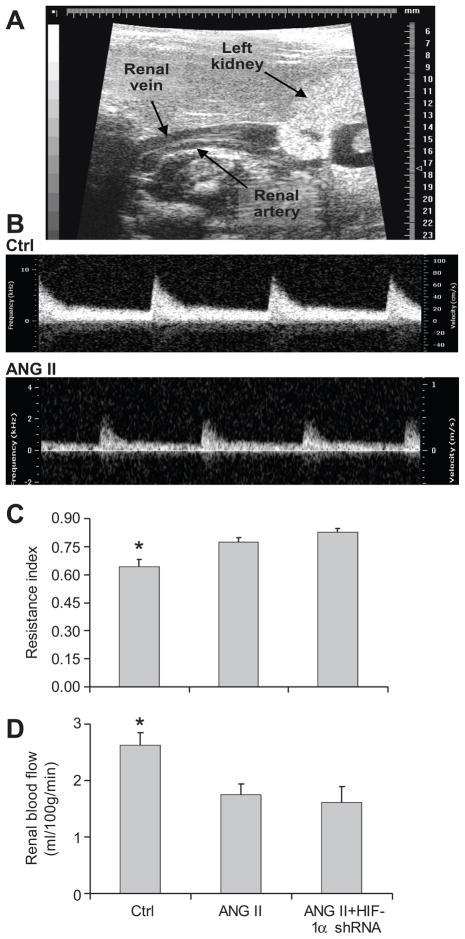
Figure 7. Effect of HIF-1α shRNA on ANG II-induced decreases in renal blood flow.
A: Representative image showing renal artery. B: Representative images showing renal blood flow velocity Doppler waveform. C: Calculated renal vascular resistance index (RI). RI = (Vs−Vd)/Vs, Vs = peak systolic velocity, Vd = end-diastolic velocity. D: Summarized renal blood flow velocity. Velocity time integral (VTI) is the area under the curve of Doppler waveform. Multiplying the VTI by cross sectional area of renal artery (π × r2) and heart rate (HR) provides an estimate of the average velocity of blood flow (cm3) during 1 minute. * P<0.05 vs. other two groups (n=4–6).

