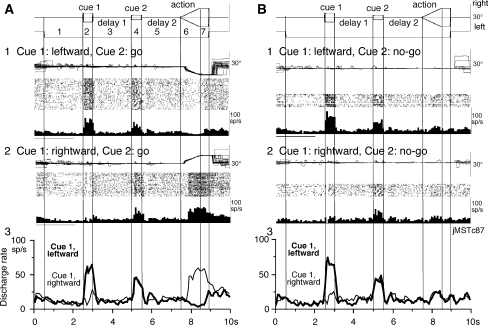
Fig. 2.
Discharge of a representative MST neuron. a1–2, go trials when leftward (a1) and rightward (a2) visual motion was applied as cue 1. b1–2, no-go trials when leftward (b1) and rightward (b2) visual motion was applied as cue 1. a3 and b3 compare mean discharge rates during leftward (thick)/rightward (thin) cue 1 visual motion for go trials (a3) and no-go trials (b3)

