Fig. 5.
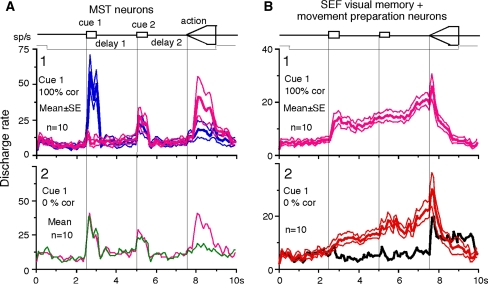
Mean discharge rates of MST neurons during go trials when cue 1 was presented as 100 and 0% correlation and comparison with SEF visual memory + movement preparation neurons. a1, blue and pink traces compare mean (±SE) discharge rates of 10 MST neurons in their preferred directions (blue) and anti-preferred directions (pink) at cue 1 when cue 1 was 100% correlation. a2, green and pink traces compare mean discharge rates of the same 10 MST neurons based on whether the monkeys pursued in the preferred directions of individual neurons during action period (pink) or anti-preferred directions (green) when cue 1 was 0% correlation. b1 plots mean (±SE) discharge rates of 10 SEF visual memory + movement preparation neurons in their preferred directions during delay 2 when cue 1 was 100% correlation. Red traces in b2 plot mean (± SE) discharge rates of the same 10 SEF neurons when the monkeys pursued in the preferred directions of individual neurons during delay 2 when cue 1 was 0% correlation. Black trace in b2 is mean discharge rate of the same 10 SEF neurons in their anti-preferred directions during delay 2 when cue 1 was 0% correlation. Traces in b2 are reanalyzed data obtained in the experiment published in Shichinohe et al. (2009)

