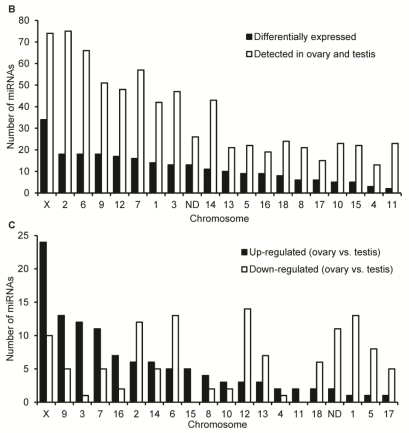
Figure 2.
Characteristics of DE miRNAs between porcine adult testis and ovary. (A) The Venn diagram displays the distribution of 673 unique miRNAs between ovary (left, blue circle) and testis (right, pink circle) libraries. The dashed circles indicate the DE unique miRNAs (P < 0.001, Bonferroni corrected) in ovary versus testis. (B) Chromosomal location of miRNAs based on the number of DE and not DE miRNAs, and (C) the number of significantly up- and down-regulated in ovary versus testis. “ND” means that the genome location of pre-miRNAs has not been determined.


