
Figure 2.
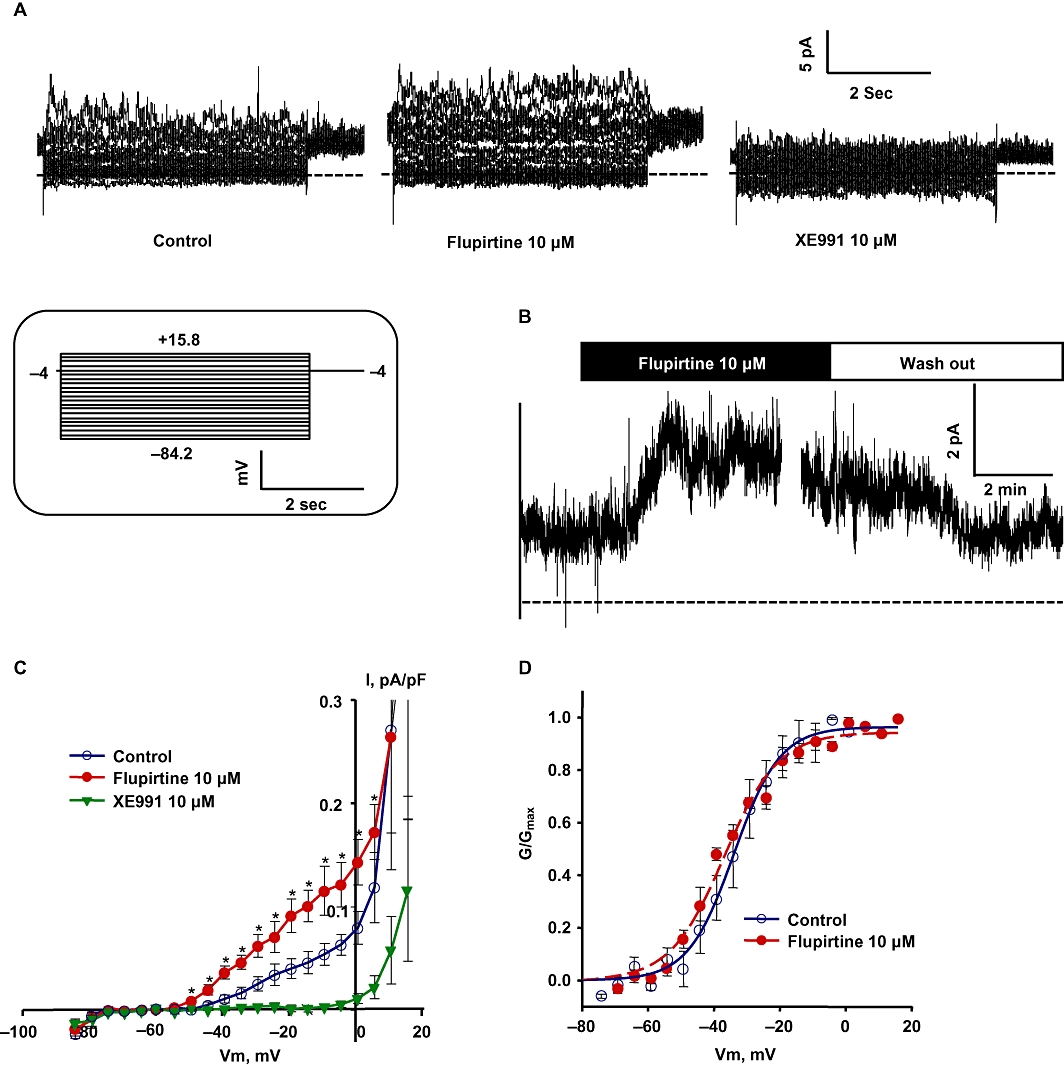
Kv7 currents in basilar artery myocytes. (A) Representative current traces recorded from a basilar artery myocyte (capacitance = 38.72 pF) under control conditions (left, untreated), treatment with 10 µM flupirtine (middle) and 10 µM XE991 (right; dotted lines indicate zero current). Inset shows the voltage protocol used to record the Kv7 currents. (B) Representative time course of Kv7 currents recorded at −20 mV in a single basilar artery myocyte before and during the application of 10 µM flupirtine. The currents were enhanced with the application of flupirtine and restored to control levels after wash out of flupirtine (bars above the trace indicate the duration of treatment or wash out). (C) Summarized I-V curves show the outwardly rectifying Kv7 currents and the response to application of 10 µM flupirtine and 10 µM XE991. Flupirtine significantly enhanced Kv7 currents at all tested voltages between −49.2 to +5.8 mV (n = 4 each, *P < 0.05, paired Student's t-test). (D) Normalized conductance plots fitted by a single Boltzmann function; control (voltage of half-maximal activation (V0.5) = −33.91 ± 1.46 mV; slope factor (s) = 6.98 ± 1.17 mV; 10 µM flupirtine (V0.5 = −36.8 ± 0.78 mV; s = 8.23 ± 0.64 mV, n = 4); G/Gmax, fraction of maximal conductance.