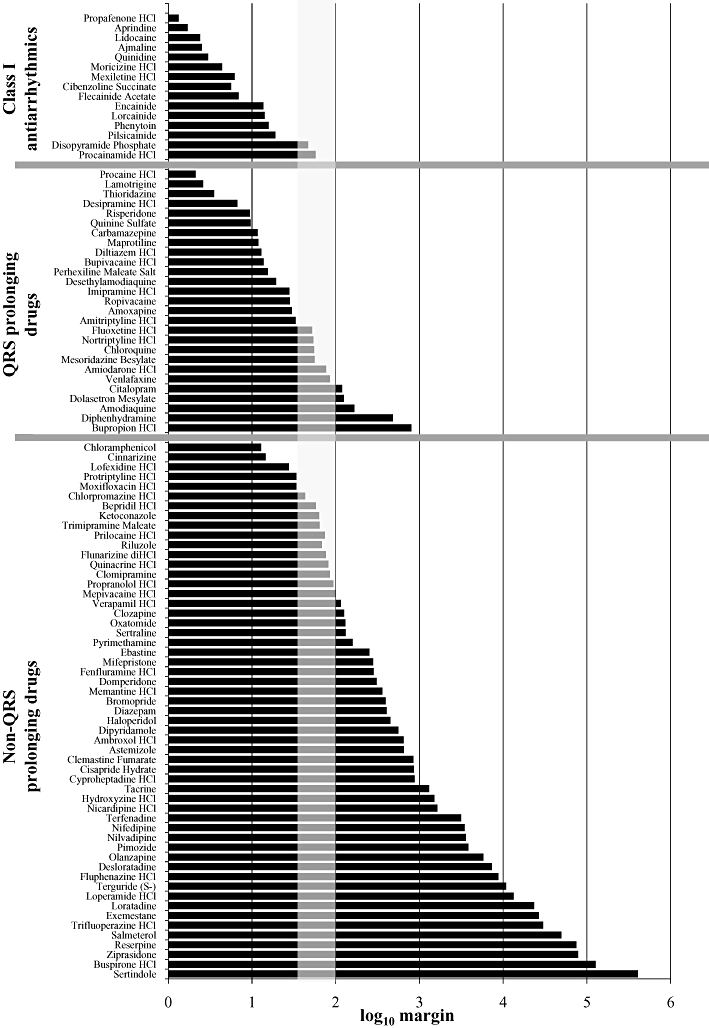
Figure 2.

Log10 of the IC50 : fCmax ratios. IC50 values at hNav1.5 channels were generated using a IonWorks™-based assay. The fCmax values are derived from published values of the maximum plasma concentration achieved in a clinical setting and the plasma protein binding value in humans. The vertical grey box indicates where ratios between 30 and 100 would fall. For source data, refer to Tables 1–3.
