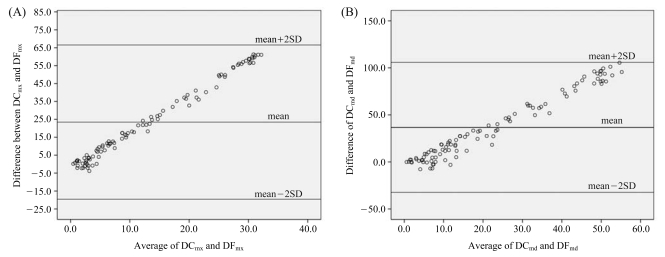
Fig. 2.
Bland-Altman plot for jaw deviation to two midsagittal planes (MSP). The x-axis indicates the average (mm) of DCs and DFs, whereas the y-axis indicates the difference (mm) between DCs and DFs. The limits of agreement (mean difference±2 SD) are graphed by the horizontal lines. A. For the maxillary deviation, B. For the mandibular deviation. Both plots demonstrate the DCs and DFs are not normally distributed by the Bland-Altman method. This means DCs are larger than DFs as the jaw midpoints (ANS and GT) are distant from the MSP.

