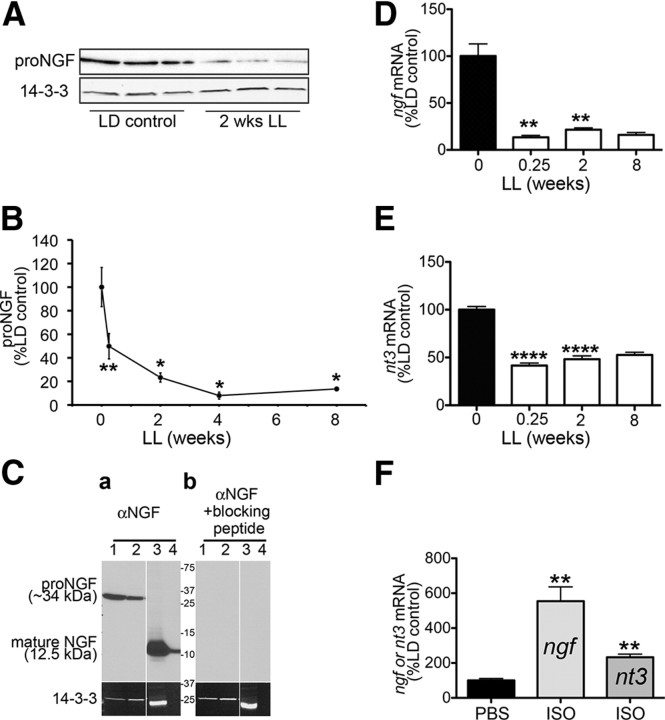
Figure 3.
Neurotrophin (NGF and NT3) expression in the pineal is progressively decreased following exposure to constant light. A, A representative Western blot analysis of pineal lysates from animals reared in either LD conditions or after 2 weeks of LL shows decrease in expression of proNGF in animals reared in LL. B, Time course of changes in proNGF expression following exposure to constant light represented as percentage proNGF relative to LD control: 50% after 0.25 weeks LL (n = 6), 23% after 2 weeks LL (n = 3), 8% at 4 weeks LL (n = 3), and 14% after 8 weeks LL (n = 3). C, Expression of proNGF in the pineal. Daytime pineal lysates from two independent rats (lanes 1 and 2) were resolved by SDS-PAGE and analyzed by immunoblot with the polyclonal anti-NGF antibody (a) or with the same antibody preincubated with blocking peptide (b). Two positive controls were used: lysate of male mouse submandibular gland (lane 3) and 7 ng of pure NGF (N6009; Sigma) (lane 4). Note that the 34 kDa band is the only detectable NGF species in the pineal lysates. Preincubation of the antibody with the NGF blocking peptide results in no NGF signal (b), confirming specificity of the pineal 34 kDa band. D, Time course of ngf mRNA, analyzed by QPCR, in pineal glands of animals maintained in 12:12 h LD conditions (n = 9) or following exposure to LL, shows a decrease in expression of ngf: 13% after 0.25 weeks LL (n = 4), 21.5% after 2 weeks LL (n = 3), and 16% after 8 weeks LL (n = 2). E, Time course of nt3 mRNA, analyzed by QPCR, in pineal glands of animals maintained in LD (n = 9) or following extended periods of LL, shows a decrease in expression of nt3 following exposure to constant light: 42% after 0.25 weeks LL (n = 4), 48% after 2 weeks LL (n = 3), and 47% after 8 weeks LL (n = 2). All animals in A–D were killed at ZT18. F, β-Adrenergic stimulation with isoproterenol (ISO) induces expression of ngf and nt3 mRNA. Expression of ngf and nt3 in the pineal, analyzed by QPCR 4 h after a single intraperitoneal injection of isoproterenol administered at ZT6, increased 5.5-fold for ngf (n = 4) and 2.3-fold for nt3 compared with vehicle-injected (PBS) controls (n = 3). Two-tailed t test was performed for statistical analysis; *p < 0.05, **p < 0.01, ****p < 0.0001. Error bars represent SEM. Animals were killed at ZT18. Silencing of circuit activity was confirmed by the absence of AANAT protein following light exposure in A and B and by the suppression of aanat mRNA in D and E following light exposure (data not shown).

