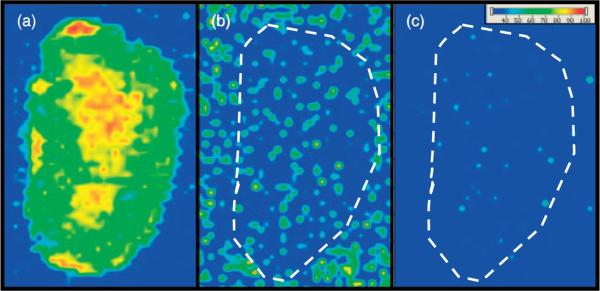
Figure 2.

MALDI-IMS of serial kidney sections from mouse dosed with 3-MoSA at 300 mg/kg and sacrificed at 30 min post-dose. (a) TCDI-treated tissue, plotting m/z 196 → 137 for 3-MoSA-TCDI. (b) Tissue not treated with TCDI, plotting 154 → 137 (underivatized 3-MoSA). (c) Tissue not treated with TCDI, plotting 196 → 137. Images are plotted as m/z 137/TIC.
