
Figure 4.
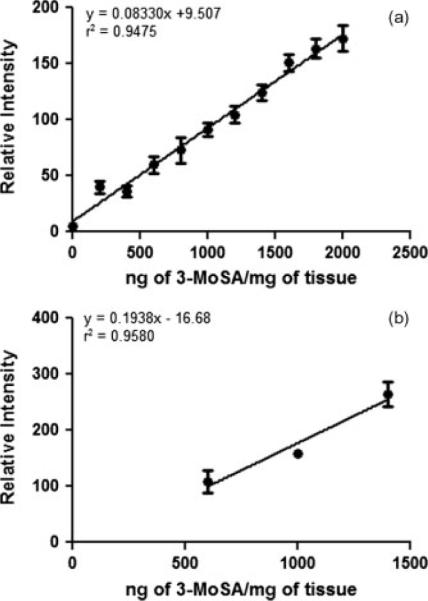
3-MoSA saturation and TCDI treatment reproducibility. (a) Plot of signal intensity for 3-MoSA-TCDI (as m/z 196 → 137) against 3-MoSA concentration in spiked kidney tissue homogenate. Samples were spotted in triplicate on the same plate and treated with TCDI in the same experiment. (b) Plot of signal intensity for 3-MoSA-TCDI against 3-MoSA concentration for three samples spotted on three different targets and treated with TCDI in three different experiments. y-axis is the average of n = 6 for each concentrations on the same MALDI target, and error bars are for three different MALDI targets. Note that the data for (b) was acquired after instrument modification which led to a higher laser intensity used in this experiment compared with (a).