
Figure 2.
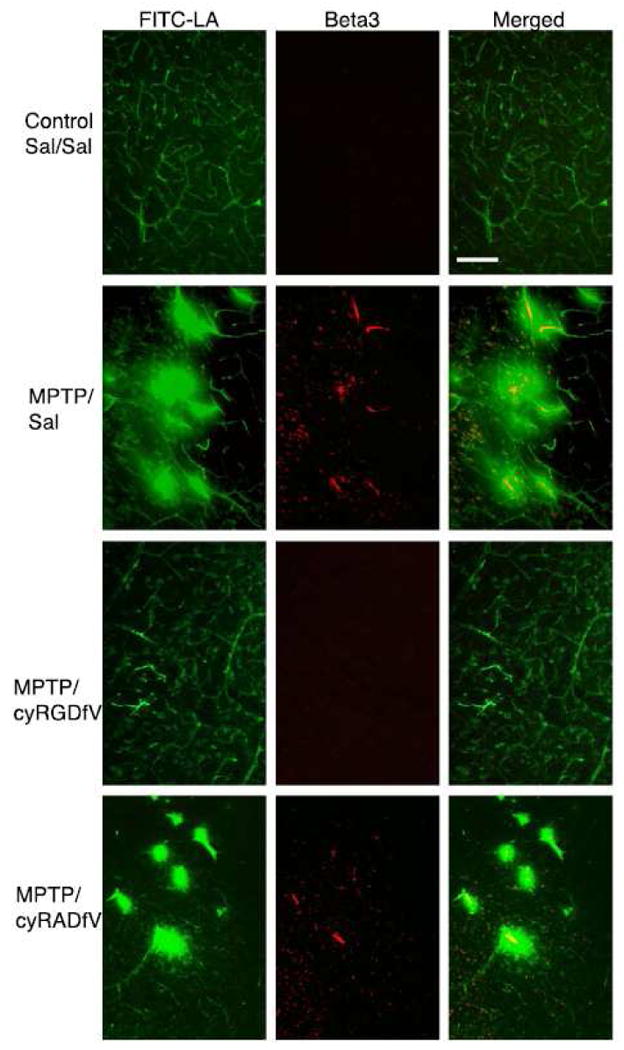
Representative photomicrographs of FITC-LA (green) and β3-ir (red) in the substantia nigra from the four treatment groups. Note in the merged figures that the β3 is generally co-localized in the center of areas of FITC-LA leakage suggesting a relationship between β3 up-regulation and leakage. (scale bar = 100 μm)