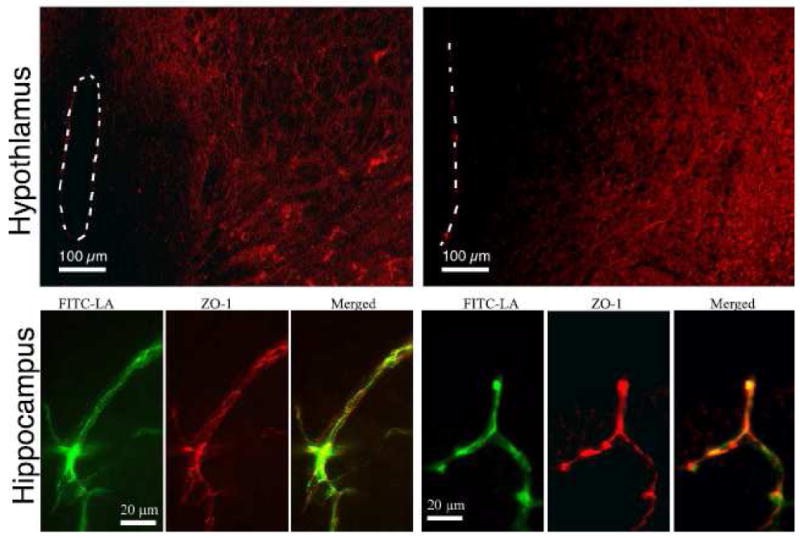
Figure 4.

Representative fluorescence photomicrographs of ZO-1 immunoreactivity in the hypothalamus and hippocampus of saline treated controls (left) and MPTP treated mice (right). The third ventricle is outlined. Note the characteristic halo effect around the ventricle where the BBB is absent (scale bar = 100 μm). In the hippocampus, note the extensive co-localization of ZO-1-ir on FITC-LA filled vessels (scale bar = 20 μm)
