Figure 5.

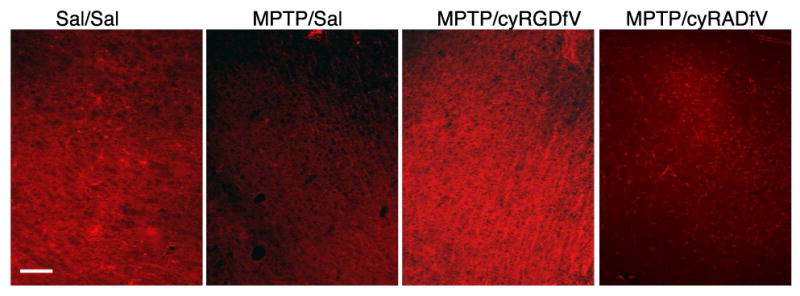
Representative fluorescence photomicrographs of ZO-1 immunoreactivity in the SN of the four treatment groups. (scale bar is 100 μm)

Representative fluorescence photomicrographs of ZO-1 immunoreactivity in the SN of the four treatment groups. (scale bar is 100 μm)