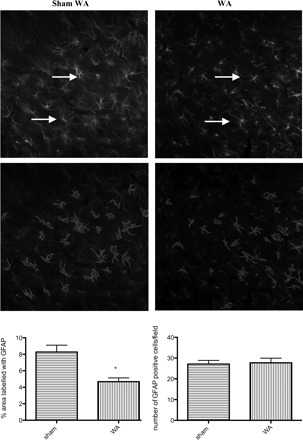
Fig. 4.

Photographs representative of immunofluorescent labeling for GFAP in selected areas of the dorsal horn in sham WA (left) and WA (right) (38 × 38 μm). Photographs are converted to grayscale and GFAP-positive cell count was performed by using the NIH Image software with individual setting adjustment (bottom images showing outlines GFAP+ cells). The density of GFAP staining was reduced in sections from WA rats compared with controls, measured in 38 × 38 μm regions in the superficial laminae (bar graph at left; P < 0.05). However, there was no significant change of the number of GFAP-positive cells in WA compared with controls (bar graph at right; n = 4, 5–8 sections counted for each n).
