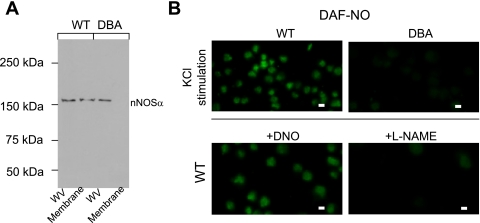
Fig. 6.
A: Western blot depicting nNOSα in WT and DBA varicosities. Note absence of nNOSα in the lane loaded with membrane extracts from DBA varicosities. Samples were boiled before loading. B: in vitro NO production after KCl stimulation in WT and DBA varicosities. Fluorescent NO signal was monitored by preloading the varicosities with the NO indicator DAF-2DA. Note that WT varicosities showed robust NO production after stimulation with 50 mM KCl. In contrast, some DBA varicosities showed only scant DAF-NO signals. Robust signals were seen after preincubation of WT varicosities with DNO. Preincubation of varicosities with l-NAME before KCl stimulation abolished DAF-NO fluorescent signal. Scale bar = 3 μm.

