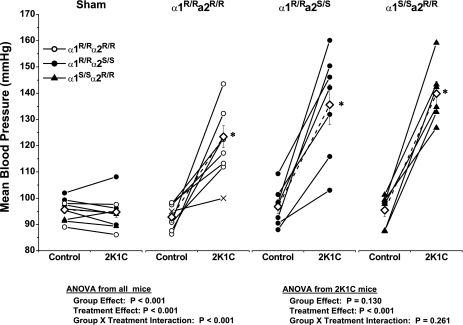
Fig. 4.
Mean arterial pressure values from individual sham and 2K1C mice. Individual values represent the average for the last 3 days before clipping and the average of days 4–6 after clipping. ◊, Group means; ×, values from a mouse in which the cuff had slipped off the artery, and these values are not included in the analysis. *P < 0.05 compared with respective control.

