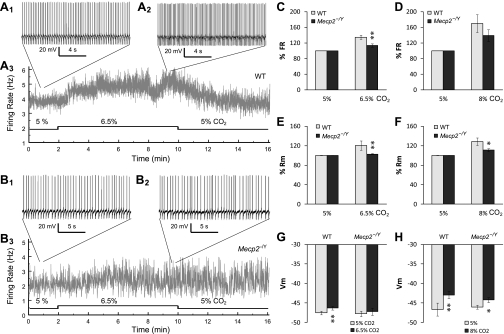
Fig. 3.
CO2 response of LC neurons. A: whole cell current clamp was made in a WT LC neuron in the brain stem slice. At baseline (5% CO2), the LC neuron fired spontaneously with basal firing rate 3.8 Hz (A1). Firing activity increased to 5.3 Hz when the cell was exposed to 6.5% CO2 (A2). A3: the instant frequency plot showed a clear increase in firing rate during 6.5% CO2 exposure. B: a representative recording from a Mecp2−/Y neuron. B1: in an LC neuron from a Mecp2−/Y mouse, baseline firing activity was 2.2 Hz. B2: the firing activity changed barely to 2.3 Hz in response to 6.5% CO2. B3: the instant frequency plot of the cell indicated a subtle increase in firing rate during hypercapnia. C and D: neuronal firing activity increased in response to 6.5 and 8% CO2. Such a cellular response to 6.5% CO2 was significantly reduced in LC neurons of Mecp2−/Y mice than in the WT. E and F: hypercapnia caused significant increases in input resistance (Rm). The effect was much smaller in Mecp2−/Y neurons than in the WT. G and H: membrane potential (Vm) response to hypercapnia. 6.5% CO2 caused clear depolarization in only WT, whereas depolarization with 8% CO2 was found in both WT and Mecp2−/Y cells (paired t-test) Significant difference: *P < 0.05; **P < 0.01. Data were obtained from 36 WT and 21 Mecp2−/Y LC neurons.

