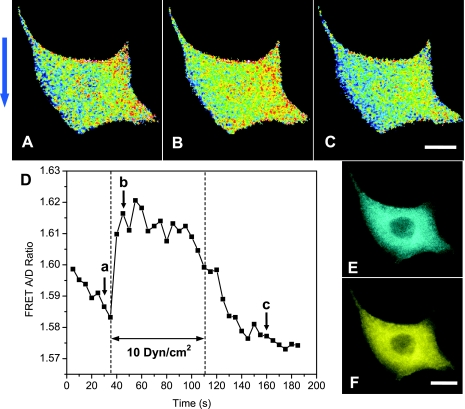
Fig. 2.
Response of actinin-FRET expressing MDCK cells to an increase of shear stress from 0.06 to 10 dyn/cm2. A–C: FRET ratio taken at the times indicated in corresponding letters in D. The color in A–C represents the acceptor-to-donor ratio of a FRET image. Red color illustrates a higher ratio, indicating lower tension or compression; blue color shows a lower ratio, a higher tension. The arrow at the left indicates the flow direction. D: time course of the average FRET ratio in response to flow change showing a reversible increase in FRET. E and F: fluorescence images of actinin-sstFRET, Cerulean (CFP donor channel) (E) and Venus [yellow fluorescent protein (YFP) accepter channel] (F). The scale bar represents 10 μm.

