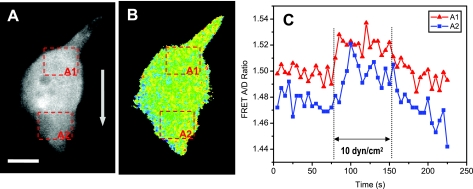
Fig. 6.
Spatiotemporal distribution of flow-induced stress in a single cell. A and B: fluorescence image (A, YFP channel) and FRET ratio (B) of actinin-sstFRET expression cell at time 0. FRET ratio was measured from two selected areas, upstream edge (A1) and downstream edge (A2), the time course of FRET signals are shown in C. The arrow in A indicates the flow direction. The scale bar represents 10 μm.

