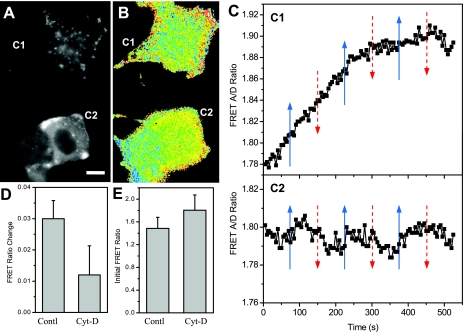
Fig. 7.
Cytoskeletal stress measured in cytochalasin-D-treated MDCK cells. A and B: yellow fluorescent protein image (A) and FRET ratio (B) of cells treated with 10 μM cytochalasin-D for 30 min. Two cells (C1 and C2) are imaged in the same field. C: responses of top cell (C1) and bottom cell (C2) to repeated increases in flow shear stress, 0.06 to 10 dyn/cm2 showing cytochalasin-D diminished the response to flow. The shear stress changes are indicated by arrows in C (blue: increase flow rate; red: decrease flow rate). D: statistics of change in FRET ratio (peak value) in response to shear stress for control (n = 7) and cytochalasin-D-treated (n = 9) cells, showing a reduction of FRET response due to the disruption of actin filaments. E: FRET ratio of control and cytochalasin-D-treated cells at rest showing how drug treatment reduced the prestress. The scale bar represents 10 μm.

