Fig. 3.
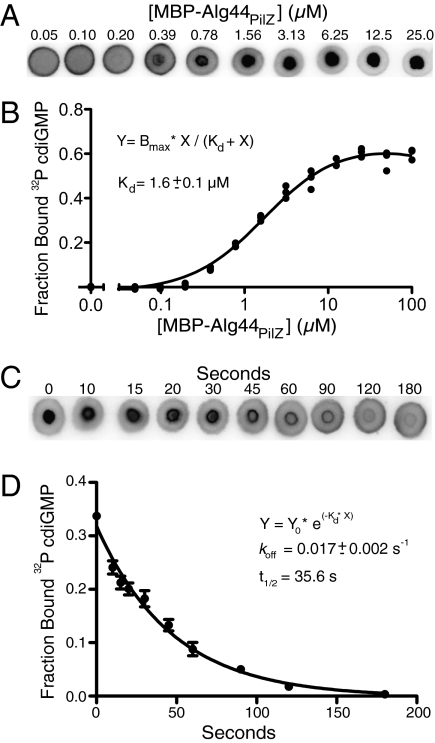
Determination of Kd and koff by DRaCALA. (A) DRaCALA images were used for Kd determination for the interaction of Alg44PilZ and cdiGMP. His-MBP-Alg44PilZ was varied from 100 μM to 6 nM, and the 32P-cdiGMP was held constant at 4 nM. Representative images of six sets of DRaCALA experiments are shown for 40 nM to 25 μM Alg44 protein. (B) FB from data in A were plotted as a function of [MBP-Alg44PilZ], and the best-fit line was determined by nonlinear regression using the indicated equation. A no-protein control was also plotted. The fitting program varied both Kd and Bmax to obtain the best fit, indicated by the solid line. (C) koff was determined by spotting protein-ligand mixtures onto nitrocellulose at various times after the addition of 1 mM cold cdiGMP to a mixture of 4 nM 32P-cdiGMP and HisMBP-Alg44PilZ. (D) Time course of decrease of FB from analysis of the data in C was fitted to a single exponential decay, indicating koff. The Itotal of each DRaCALA spot in Fig. 3 A and C is provided in Tables S3 and S4, respectively.

