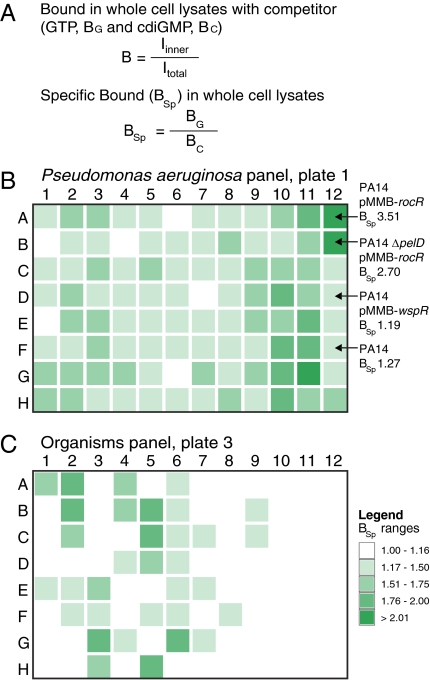
Fig. 5.
Analysis of cdiGMP-binding proteins in various organisms. BSp values of whole-cell lysates are shown as a heat map using the range indicated in the legend. (A) Equations used to analyze DRaCALA data for BSp for whole-cell lysates or tissue extracts. (B) Plate 1 is the analysis of cdiGMP binding by lysates from P. aeruginosa isolates. Specific strains discussed in the text are indicated by arrows. Sources of all strains in plates 1 and 2, as well as the raw data for each lysate, are shown in Table S7. (C) Plate 3 is the analysis of cdiGMP binding by lysates from various organisms. Plate numbers, column numbers, and row letters correspond to the strains and organisms listed in Tables S7 and S8.

