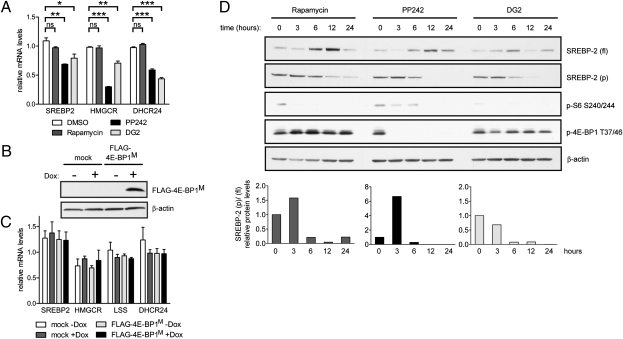
Fig. 3.
mTORC1 effector S6K1 controls SREBP-2 processing and cholesterol biosynthetic gene expression in HCC cells. (A) HCC cells were treated as indicated in Fig. 1B, and relative mRNA levels were assessed by qRT-PCR. (B) HCC cells were transfected as described in Fig. 2C, followed by immunoblot analysis. (C) HCC cells were transfected as in B, and mRNA levels were analyzed by qRT-PCR. No differences were statistically significant. (D) HCC cells were treated with the inhibitors described in A over a 24-h time course. One hour before lysis, cells were treated with 25 μg/mL ALLN and cell lysates were prepared for Western blotting. (Bottom) Protein levels were quantified, and the ratio of processed to full-length SREBP-2 is shown throughout the time course (*P < 0.05; **P < 0.01; ***P < 0.001; ns, not significant).

