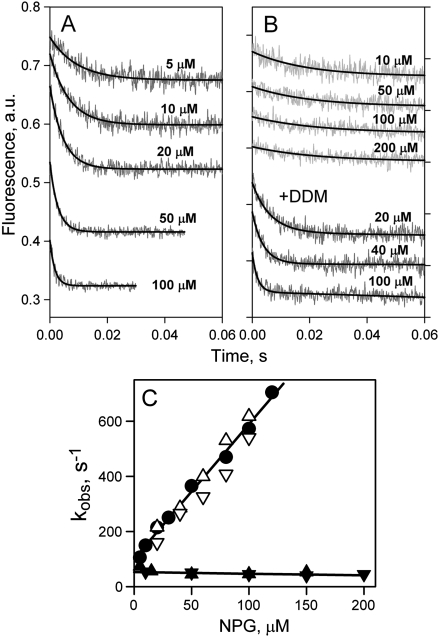
Fig. 3.
Rates of NPG binding to C154G LacY. (A) Stopped-flow traces of Trp fluorescence change were recorded in DDM at indicated sugar concentrations as described in Fig. 2A. Single-exponential fits are shown as black lines. (B) Stopped-flow traces of NPG binding to mutant C154G reconstituted into proteoliposomes are shown at four sugar concentrations (upper four traces). The three lower traces represent binding of NPG to the same proteoliposomes dissolved in 0.3% DDM. Single-exponential fits are shown as black solid lines. (C) Concentration dependence of rates of NPG binding (kobs) to C154G LacY. The rates measured in DDM, proteoliposomes, or dissolved proteoliposomes are presented with symbols described in Fig. 2C. Linear fits to the data are shown as solid lines. Mutant C154G reconstituted into proteoliposomes binds NPG with kobs = 51 ± 10 s-1.

