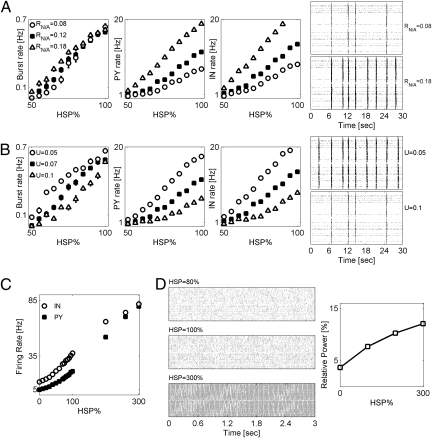
Fig. 1.
Patterns of networks’ activity in 2D deafferented networks depend on synaptic plasticity and neuronal excitability. (A, plot 1) Burst rate vs. HSP for different NMDA–AMPA conductance ratios: RNIA = 0.08 (circles), RNIA = 0.12 (squares, baseline model), and RNIA = 0.18 (triangles). (A, plots 2 and 3) Averaged rates of PY and IN neurons firing vs. HSP for the different scenarios shown in plot 1. (A, plot 4) Raster plots for a fixed level of HSP (60%) and different NMDA–AMPA conductance ratios: RNIA = 0.08 (top raster) and RNIA = 0.18 (bottom raster). Neurons (both PY and IN) were randomly sampled from the central block of 20 × 20 neurons. Deafferentation was fD = 0.9 and rD = 0.1, and it was spatially random. Data points are mean ± SEM (n = 5). (B, plot 1) Burst rate vs. HSP for different parameters of synaptic depression: U = 0.05 (circles), U = 0.07 (squares, baseline model), and U = 0.1 (triangles). (A, plots 2 and 3) Averaged rates of PY and IN neurons firing vs. HSP for different scenarios shown in plot 1. (A, plot 4) Raster plots for a fixed level of HSP (60%) and different values of U: U = 0.05 (top raster) and U = 0.1 (bottom raster). Neuronal sampling and deafferentation were as shown in A. Data points are mean ± SEM (n = 5). (C) Firing rate of PY (closed squares) and IN (open circles) neurons vs. HSP in an intact model network. (D Left) Raster plots of intact network activity vs. HSP. (D Right) Relative power of collective activity in the γ-band (40–90 Hz) vs. HSP.

