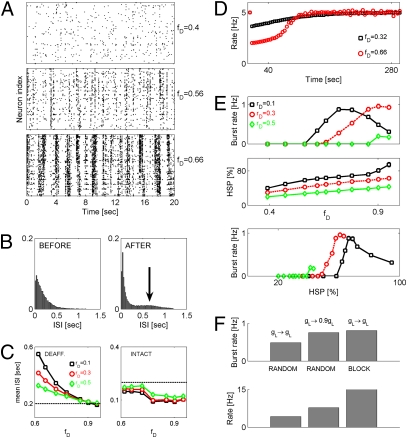
Fig. 2.
Posttraumatic reorganization of activity. (A) Raster plots (in posttraumatic steady state) exemplifying reorganization of activity by HSP: rD = 0.1 and fD = 0.4 (Top), rD = 0.1 and fD = 0.56 (Middle), and rD = 0.1 and fD = 0.66 (Bottom). Neurons were randomly sampled from the central block of 20 × 20 neurons. (B) Distributions of ISIs before (Left) and after (Right) spatially random deafferentation. Location of the second smaller peak in the ISI distribution of posttraumatic network is indicated by an arrow. (C) Mean ISIs (in steady state) of deafferented (Left) and intact (Right) neurons vs. fD: rD = 0.1 (squares), rD = 0.3 (circles), and rD = 0.5 (diamonds). (D) Dynamics of PY firing rates. Squares: fD = 0.32 and rD = 0.1. Circles: fD = 0.66 and rD = 0.1. (E Top) Rate of network bursts vs. fD. Squares: rD = 0.1. Circles and dashed line: rD = 0.3. Diamonds: rD = 0.5. (E Middle) HSP (PY–PY synaptic scaling factor) in steady state vs. fD. (E Bottom) Burst rate vs. HSP. Data points are mean ± SEM (n = 5). (F Upper) Burst rate in severely deafferented network (rD = 0.1 and fD = 0.9) is modulated by  (center bar) or the spatial organization of intact neurons (right bar). (F Lower) Firing rates of intact PY neurons for cases shown in F Upper.

