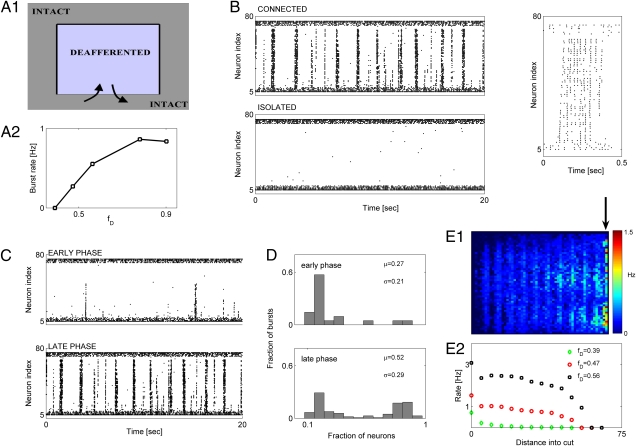
Fig. 4.
Characteristics of burst propagation in structurally deafferented model cortical networks. (A, 1) Schematic of deafferentation scenario. (A, 2) Burst rate vs. fD. For all cases, rD = 0.1. (B Upper Left) Activity in network for which deafferented region is connected to the intact network (same as in A). (B Lower Left) Activity in network for which deafferented region was completely isolated from the intact network. (B Right) Raster plot showing fine spatiotemporal structure of a sample burst. In all panels, activity of a single column (1D cross-section; 80 neurons), oriented perpendicular to the connecting interface, is shown. Deafferentation parameters are rD = 0.1 and fD = 0.56. (C Upper) Partially propagating bursts in the window of 80–100 s after deafferentation. (C Lower) Fully propagating bursts in the window of 280–300 s after deafferentation. Deafferentation parameters are rD = 0.1 and fD = 0.56. (D) Distribution of burst intensity during early (D Upper) and late (D Lower) phases of HSP for windows as in C. (E, 1) Spatial map of mean firing rate in posttraumatic steady state. Cool and warm colors are for lower and higher rates of firing, respectively. Contact between the deafferented and intact region is collinear with the arrow. (E, 2) Averaged firing rates of deafferented neurons vs. the distance from the line of contact: fD = 0.39 and rD = 0.1 (green diamonds); fD = 0.47 and rD = 0.1 (red circles); fD = 0.56 and rD = 0.1 (black squares). In E, 1 and 2, the firing rate was computed over a time window of 40 s.

