Fig. 2.
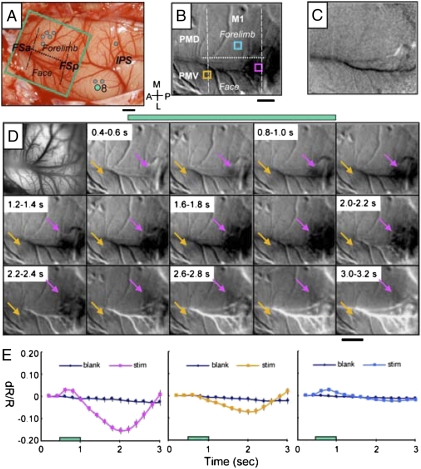
Intrinsic cortical activity in response to electrical stimulation of PPC in galago 08-08. Electrical stimulation (300-μA, 500-ms train) of the face region of ventral PPC evoked a face defensive movement. (A) Pattern of blood vessels on the exposed brain surface. Green rectangle marks imaged M1-PM field. Green dot 8 in face representation of PPC indicates the site of electrical stimulation for illustrated cortical activation. Gray dots mark other stimulation sites. Dashed lines indicate approximate borders of M1, and the dotted line indicates the border between the forelimb and face M1 representations. (B) Intrinsic response (dark region) temporally averaged 1–2 s after stimulus onset. (C) Blank response during the no stimulus condition. (D) Image maps showing time course of activation after stimulation onset. Frame duration is 200 ms. The first frame is the corresponding blood vessel map of images. Activations in M1 and PMV are indicated with pink and yellow arrows, respectively. (E) Time course of changes in reflectance from three regions of interest centered over (Left) M1 (pink box in B), (Center) M1/PMV (yellow box in B), and (Right) dorsal M1 (blue box in B) in trials with electrical stimulation (colored lines) and blank trials (black lines). Stimulation period is indicated by green bars in D and E. Error bars = SD. (Scale bar: 1 mm.) A, anterior; M, medial; L, lateral; P, posterior. Imaged left cortex from 18 trials.

