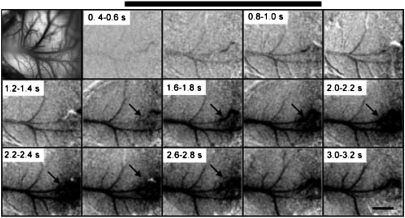
Fig. 3.
Time course of cortical activation from an individual trial in case 08-08 (compare with Fig. 2). The top left frame shows a photograph of the imaged cortex. Subsequent frames correspond to a sequence of 200-ms imaging times from a single trial. The black bar represents the stimulus. (Scale bar: 1 mm.)

