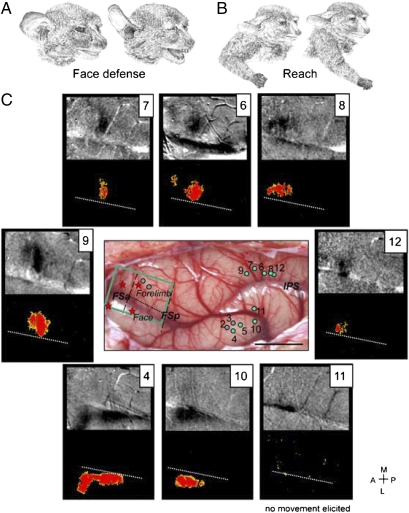
Fig. 4.
Maps of activation evoked by electrical stimulation of PPC in galago 08-18. Electrical stimulation of PPC (300- to 400-μA, 500-ms trains) that evokes face (A) and arm (B) behaviors produces topographical activation of the M1-PM cortex, which is revealed by intrinsic optical imaging of the hemodynamic response. (C) Activity maps (4–12) recorded for face and forelimb movements. Evoked face movements: 4, defensive face (+ mouth opens); 10, defensive face. Evoked forelimb movements: 6, forward reach; 7, forward reach, 8, slight arm lift + ear; 9, lateral outward reach; 12, arm lift. Stimulation of 11 (face region) did not evoke any movement. For clarity, each intrinsic optical imaging map is paired with a t-test map of cortical motor activity after filtering out random occurring pixels and small clusters of pixels. The t-test map for 11 is presented without filtering to illustrate the level of random significant pixels. White dotted lines in t-test maps mark the borders between forelimb and face representations. Green dots on the dorsolateral view of the exposed cortical surface (C Middle Center) mark the stimulation sites for shown activation maps. Gray dots mark other stimulated sites. Red stars mark lesions. (Scale bar: 5 mm.) Other conventions are as in Figs. 1 and 2.

