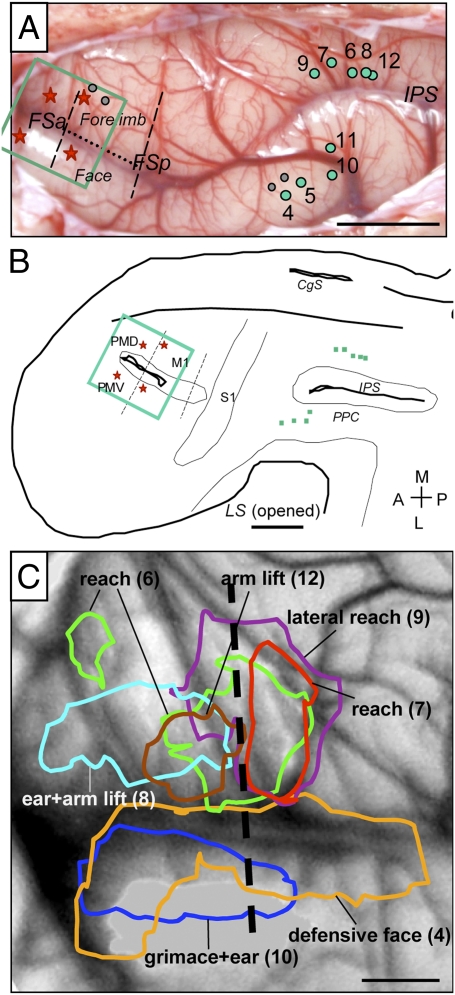
Fig. 5.
Areas of activation elicited by electrical stimulation of PPC in case 08-18. (A) Photomicrograph of exposed cortical surface shows the pattern of blood vessels with the marked M1-PM imaged region (green rectangle) and sites of stimulation in PPC (green dots). (B) Reconstructions of the left brain hemisphere shown on the flattened view with stimulated sites (green dots) and areal borders approximated from CO and myelin sections. The green rectangle marks the imaged field. (C) Areas of activation overlaid on a blood vessels map. Stimulus amplitudes were 300–400 μA. Areas activated during face movements were observed laterally, and areas activated during forelimb movements were observed medially. (Scale bars: A and B, 5 mm; C, 1 mm.) Other conventions are the same as in Figs. 1 and 2.

