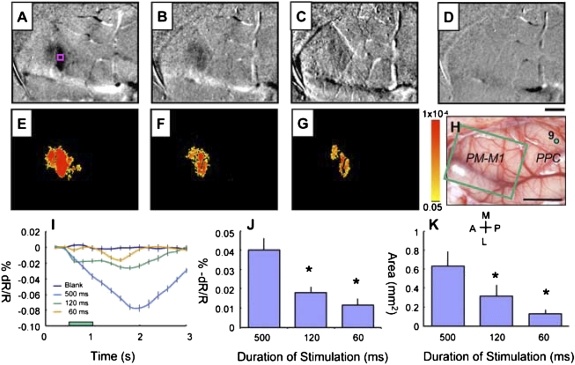
Fig. 6.
Intrinsic motor cortex activity to different durations of electrical stimulation of PPC in case 08-18. Electrical stimulation (400 μA) of the dorsal PPC (green dot 9 in H) evoked a lateral reaching movement. (A–D) Optical imaging maps and (E–G) t-test maps of motor cortical activity to 500- (A and E), 120- (B and F), and 60-ms (C and G) duration of stimulus. (D) Image map for the no stimulus blank condition. (H) Blood vessels image shows imaged frontal M1-PM region (green rectangle) with site of stimulation in PPC (green dot 9). (I) Change in reflectance for a region of interest (pink square in A) vs. time for different stimulus train durations to stimulation at site 9. (J) Peak percent change in reflectance to 500-, 120-, and 60-ms stimulation for six different sites of stimulation. (K) Area of activation as measured by the number of significant pixels (P < 0.01, uncorrected) to 500-, 120-, and 60-ms stimulation for six different sites of stimulation. *P < 0.01, 500 ms > 120 ms, 500 ms > 60 ms. Clip value = 0.05%. (Scale bars: A–G, 1 mm; H, 5 mm.) Other conventions are the same as in Fig. 2.

