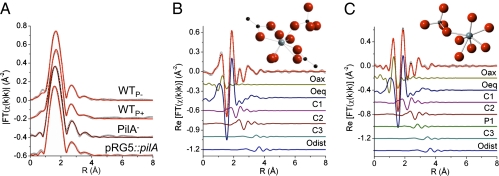
Fig. 2.
U LIII-edge EXAFS spectra (symbols) and models (line). (A) Magnitude of Fourier transform spectra are offset for clarity. (B and C) Real part of Fourier transform of WTP+ (B) and PilA− (C). The components of the model are shown offset beneath the total model. (B and C Insets) U(IV) moiety consistent with the measured EXAFS spectra. U(IV), light gray; O, red; C, black; P, dark gray.

