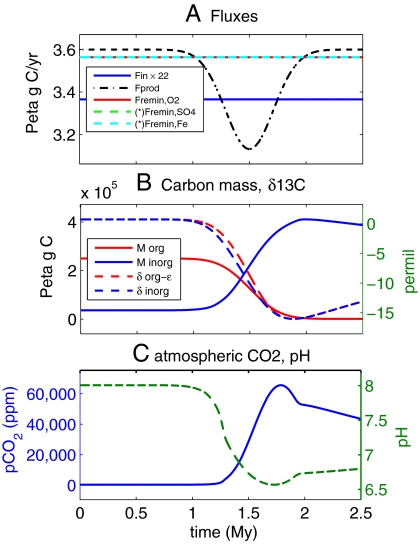
Fig. 1.
Time-dependent results of scenario #1, a net aerobic remineralization of organic matter leading to a negative δ13C isotopic excursion. Time advances from left to right. (A) Prescribed carbon fluxes; the only flux prescribed to change in this scenario is the decreasing oxygenic production Fprod forcing the isotopic signal. (*) Anaerobic remineralization fluxes are plotted shifted and are identically zero in this scenario. (B) Dissolved organic and inorganic carbon masses (solid lines) and δ13C isotopic compositions (dashed). (C) Atmospheric pCO2 (ppm) showing a large increase, due to the increase in dissolved inorganic carbon concentration, and a decrease in ocean pH.

