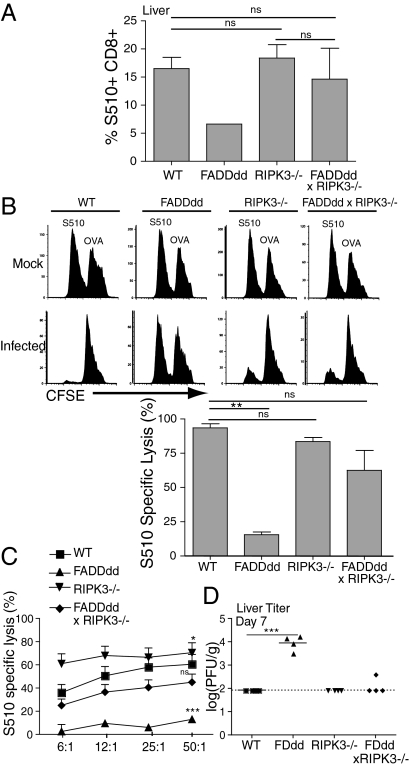
Fig. 3.
FADDdd × RIPK3−/− mice exhibit normal immune response to murine hepatitis virus (MHV) infection. (A) T cells from livers of infected mice were stained with MHV-specific (S510) tetramer. Graph represents percentage of S510-positive cells of total CD8+ cells. (B) Nonspecific and specific target cells were labeled with CFSEhi/low, respectively, and adoptively transferred into infected and sham mice for in vivo CTL analysis shown by FACS plots. Graph displays percent specific lysis (**P < 0.01). (C) Splenocytes from infected and sham mice were incubated with specific/nonspecific target cells for 4 h to measure in vitro CTL activity. Graph represents percent specific lysis. Considered a significant difference with respect to WT specific lysis (*P < 0.01, ***P < 0.001). (D) Livers from infected mice were harvested 7 d after infection for viral titer analysis. Error bars indicate SEM (***P < 0.001).

