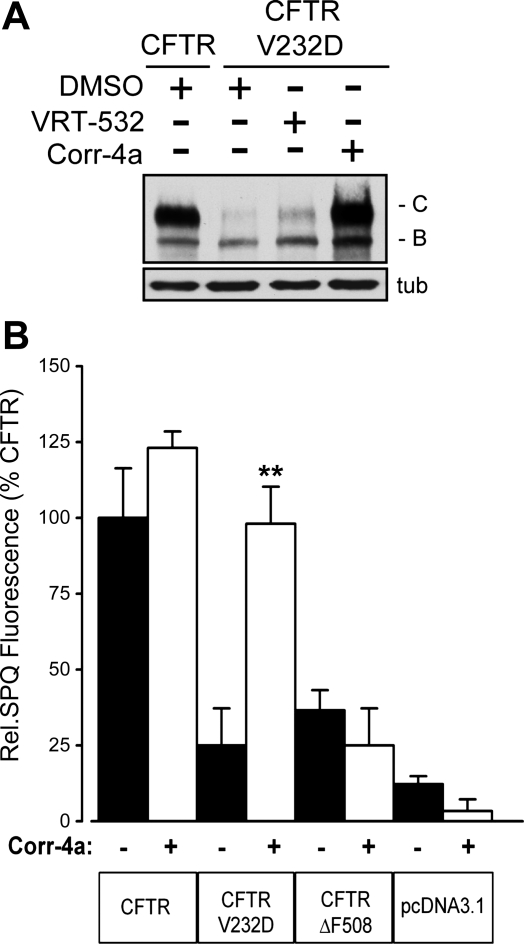
Fig. 1.
Folding-corrected CFTRV232D protein expression and function. A: Western blot analysis of CFTR and CFTRV232D protein expression. Immature and mature glycosylated forms are represented by bands B and C, respectively. N-(2–5-chloro-2-methoxyphenylamino)4′-methyl[4,5′′bithiazolyl-2′-yl]-benzamide (Corr-4a) enhanced accumulation of CFTRV232D band C protein relative to vehicle-treated (DMSO) control. A modest increase in band C formation was also apparent with 4-methyl-2-(5-phenyl-1H-pyrazol-3-yl)-phenol (VRT-532) treatment. Human embryonic kidney (HEK-293) cells were transfected with pcDNA3.1 expression vector ± CFTR or CFTRV232D and pretreated overnight with Corr-4a (5 μM), VRT-532 (10 μM), or DMSO before lysis and protein blotting; α-tubulin (tub) was used to confirm equal protein loading across lanes. B: 6-methoxy-N-(3-sulfopropyl)quinolinium (SPQ) fluorescence from transfected Cos-7 cells. Cells were pretreated (24 h) with Corr-4a (5 μM, open bars) or DMSO (filled bars). Fluorescence was measured every 60 s following cell stimulation with PKA agonist cocktail. Steady-state fluorescence was plotted from measurements taken 240 s after PKA agonist cocktail addition. Data were normalized to CFTR fluorescence at 240 s. Values are means ± SE (n=3). **P=0.001 vs. DMSO alone. SPQ fluorescence of Corr-4a-pretreated CFTRV232D-transfected cells was not statistically different from that of DMSO-treated CFTR-transfected cells (P=1.00). Mean fluorescence signals between treatments and groups from CFTRΔF508 (Corr-4a, DMSO), CFTRV232D (DMSO), and pcDNA3.1 (Corr-4a, DMSO) were not significantly different (P=0.33–0.98). Cells were cultured and maintained at 37°C continuously throughout the experiments.

