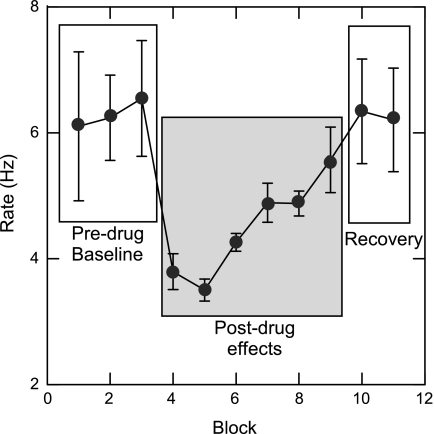
Fig. 4.
Line graph representing full recovery of a Damgo-evoked rate effect for an individual animal. The single line represents averaged lick and gape rate across all three taste stimuli-sucrose, water, and quinine. Before Damgo, the rate of responding for all stimuli averaged ∼6 Hz. After Damgo (block 4), rate dropped below 4 Hz. By block 10 (∼70 min postinfusion), the rate effect fully recovered to 6 Hz. Notice that before Damgo (predrug baseline) and the recovery phase, standard error bars are large, indicative of the normal rate variation associated with licks vs. gapes evoked by the different taste stimuli (sucrose and water: 6–7 Hz; quinine: 3–4 Hz). However, immediately after Damgo, the rate of responding to all three stimuli was similar at 3–4 Hz.

