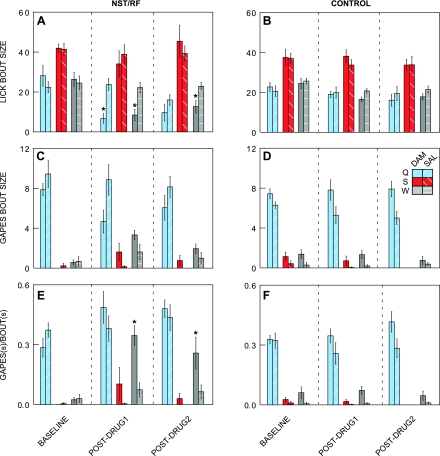
Fig. 6.
Bar graphs depicting lick bout size, gape bout size, and the proportion of time spent gaping before and after Damgo or saline infusions into the rNST/RF or control sites. The three taste stimuli are color coded: quinine = blue; sucrose = red; and water = gray. Results from the Damgo condition are represented with solid bars, whereas data from the saline condition are represented by hatch marks. *Significant differences between the Damgo and saline condition in response to a particular taste stimulus. Damgo in the rNST/RF significantly reduced the size of lick bouts to quinine and water compared with saline (A). Additionally, Damgo in the rNST/RF increased the proportion of time spent gaping relative to the total bout duration in response to water (E). No significant differences emerged between the Damgo and saline injections for control sites medial to or above the rNST (B, D, F).

