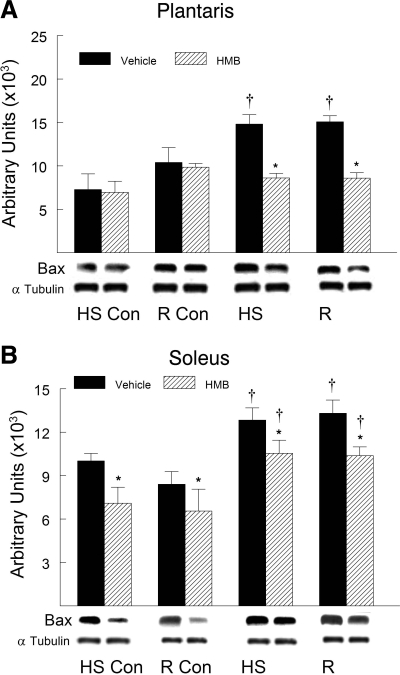
Fig. 7.
Bax protein abundance was determined by Western blot analysis in the plantaris (A) and soleus (B) muscles of rats under control, HS, or reloading conditions. Groups include: controls for the HS group (HS-Con), controls for the recovery group (R-Con), and in experimental animals after 14 days of HS or after 14 days of HS followed by 14 days of reloading (R). Animals received HMB or the vehicle (water) daily by gavage, for a total of 21 days (HS-Con and HS) or for 32 days (R-Con and R). Eight animals were in each diet and experimental group. α-Tubulin was used as a loading control. Data were normalized to α-tubulin and were expressed as means ± SD. An ANOVA followed by Bonferroni post hoc analyses was used to evaluate the differences between the group means. *P < 0.05, vehicle vs. HMB within the same condition; †P < 0.05, HS or R vs. control animals for that experimental condition.

