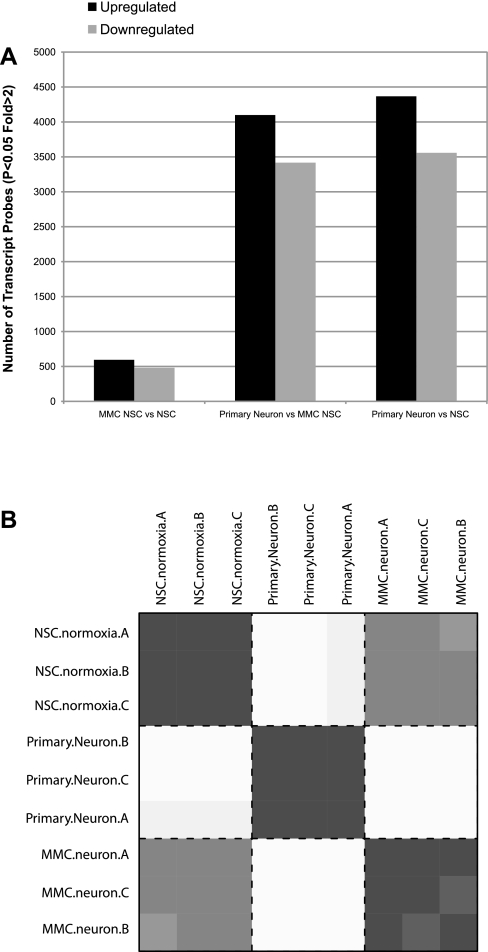
Fig. 2.
Microarray analysis of NSCs and neurons. A: number of microarray probes up- and downregulated comparing NSC ± MMC and primary isolated neurons. MMC, mitomycin C. B: heat plot representing all possible pairwise hierarchical ordered partitioning and collapsing hybrid (HOPACH) correlation (euclidean) values. Darkest values indicate a high level of correlation (= 1 across the diagonal), and lighter gray indicates lower correlation values.

