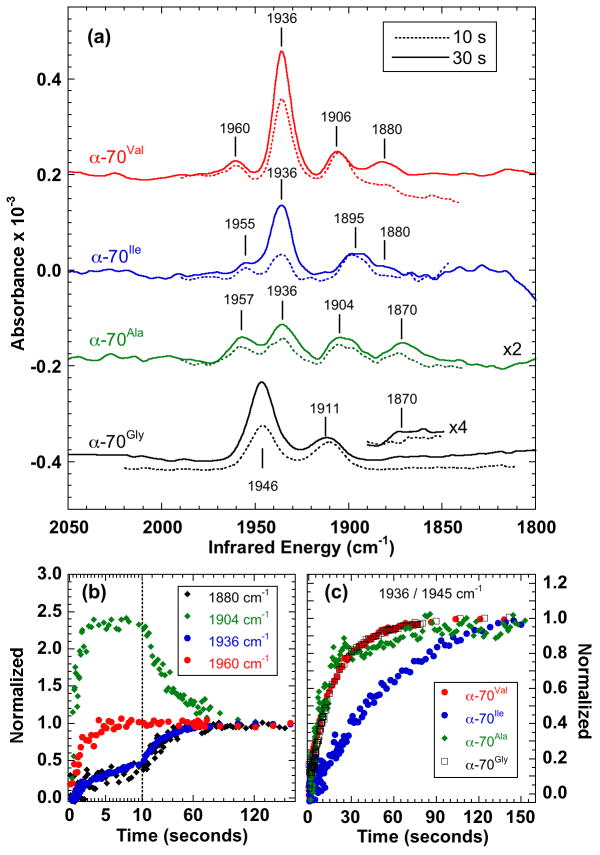
Figure 2.
Transient IR spectra of the A. vinelandii MoFe nitrogenase hi-CO complex showing the effect of varying the size of the α-70 sidechain. (a) Spectra averaged (solid line) 25 – 35 s and (broken line) 6 – 14 s after mixing. (b) Time courses for wild-type (α-70Val) measured at 1880, 1904, 1936 and 1960 cm−1, (c) Comparison of time courses at 1936 cm−1 (α-70Val, α-70Ile, α-70Ala) and 1945 cm−1 (α-70Gly). Intensities in (b) and (c) are normalized at 150 s.

