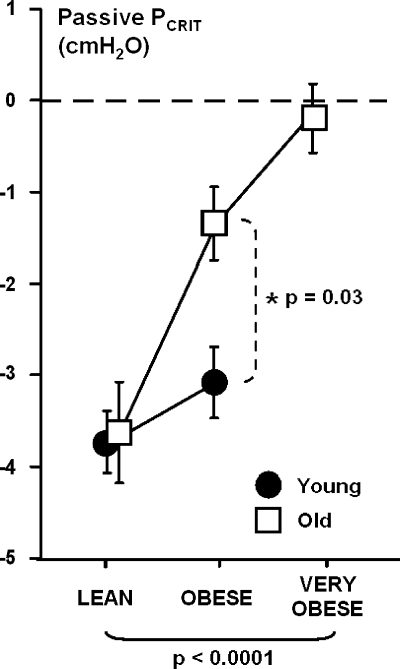
Fig. 2.
Passive Pcrit by weight group for young and old mice. Values are means ± SE. Passive Pcrit increased progressively with increasing body weight, independent of age (P < 0.0001). In addition, passive Pcrit increased more with weight in old than young obese mice (P = 0.03). Passive Pcrit increased significantly with weight in young (P = 0.003) and old (P < 0.0001) mice.

