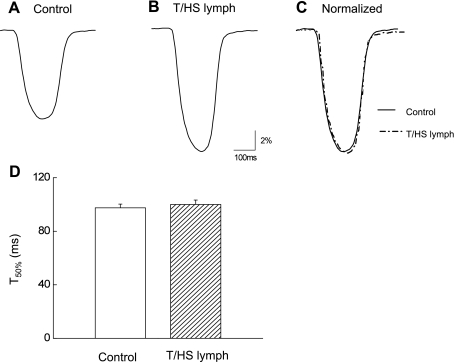
Fig. 3.
Left ventricular (LV) myocyte cell shortening recordings in control (A) and during stimulatory effects of T/HS lymph (B; 1%). C: traces were also normalized and superimposed to compare the time course of myocyte contraction. D: pooled data for half-time of twitch contraction (T50%). Data are expressed as means ± SE (n = 16 from 5 rats). *P < 0.05 vs. control.

