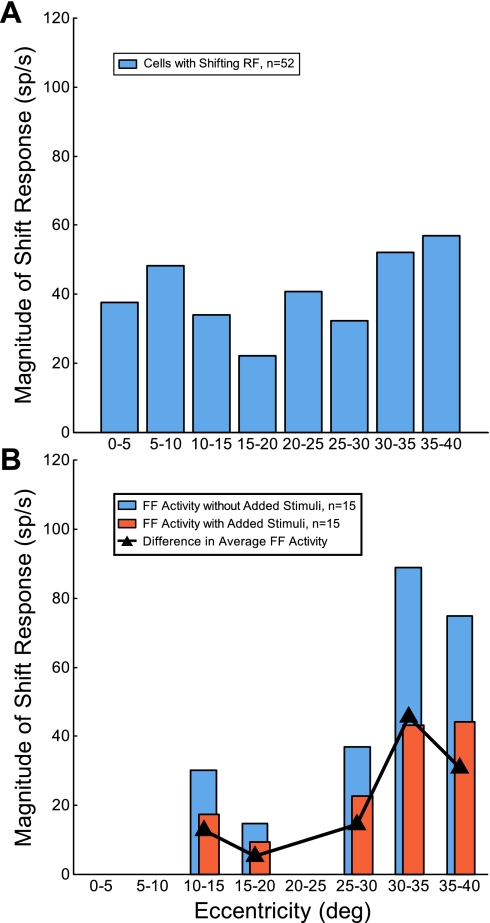
Fig. 6.
Magnitude of FF activity across RF eccentricity. A: distribution (bin width 5°) of the magnitude of FF activity as a function of RF eccentricity (n = 52). The height of each bar represents the average FF activity for the cells that fell within that bin. B: distribution (bin width 5°) of the FF activity with (orange bars) and without added stimuli (blue bars) as a function of RF eccentricity. The black trace represents the difference in mean FF activity with and without added stimuli. Only cells with a significant decrease (P < 0.05, 2-tailed t-test) in FF activity with added stimuli are displayed (n = 15). The height of each bar represents the average activity for the cells that fell within that bin. The gaps at the 3 eccentricity ranges are due to a lack of cells that demonstrated a significant decrease in the FF activity with added stimuli.

